
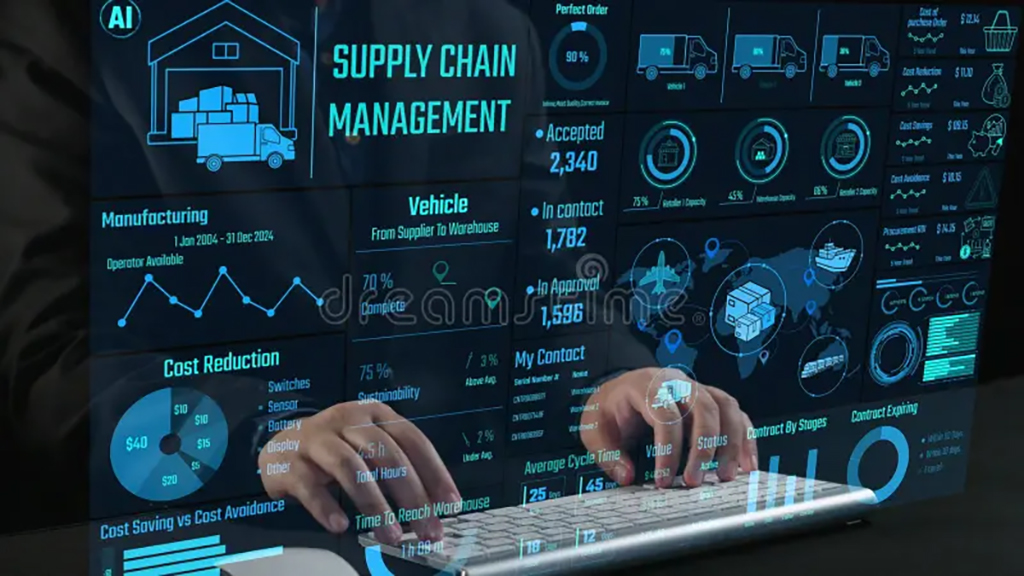
This course is designed to help supply chain professionals transform operational data into actionable business insights using Microsoft Excel and Microsoft Power BI. It combines analytical techniques, practical spreadsheet modelling, data visualisation, dashboard development, and performance measurement across demand planning, inventory, procurement, logistics, warehousing, and supply chain operations.
The programme progresses from data preparation and descriptive analytics to advanced Excel analysis, Power Query, data modelling, DAX calculations, interactive Power BI dashboards, and decision-making through business case studies.
The Supply Chain Analytics with Excel and Power BI course equips participants with practical skills to analyse supply chain data and transform it into actionable business insights. The programme combines Microsoft Excel techniques with Power BI capabilities to support demand forecasting, inventory optimisation, procurement analysis, logistics performance measurement, and operational decision-making.
Participants will learn to clean datasets, apply analytical formulas, build data models, develop interactive dashboards, and monitor key performance indicators. Through hands-on exercises, realistic case studies, and practical projects, learners will develop the ability to identify performance gaps, investigate operational problems, communicate findings effectively, and support data-driven improvements across the supply chain.
Course Objectives
The objective of this course is to develop participants’ analytical capabilities in using Microsoft Excel and Power BI to improve supply chain visibility, efficiency, and decision-making. The programme aims to build proficiency in data preparation, spreadsheet analysis, statistical techniques, forecasting, inventory modelling, procurement analytics, transportation cost analysis, and operational performance measurement.
Participants will learn to transform raw datasets into reliable information, create analytical models, establish meaningful KPIs, and develop interactive dashboards for management reporting. The course also focuses on identifying trends, exceptions, bottlenecks, and improvement opportunities through structured data analysis. By combining practical exercises with real-world supply chain scenarios, participants will gain the confidence to communicate evidence-based recommendations and support continuous improvement across planning, sourcing, logistics, warehousing, and distribution operations.
Target Audience
This course is suitable for supply chain managers, demand planners, inventory controllers, procurement professionals, logistics coordinators, warehouse managers, operations analysts, production planners, and distribution specialists seeking to strengthen their data analysis skills. It is particularly valuable for professionals responsible for monitoring KPIs, analysing costs, evaluating supplier performance, improving inventory availability, forecasting demand, and preparing management reports.
Business analysts, management consultants, finance professionals supporting supply chain operations, and reporting specialists can also benefit from the programme. Graduates and early-career professionals aspiring to work in supply chain analytics are welcome. Participants should have basic computer literacy and a general understanding of business or supply chain processes. Prior experience with Excel is helpful, but the course can accommodate learners progressing from foundational spreadsheet skills to practical Power BI dashboard development.
Learning Objectives
By the end of the course, participants should be able to:
- Explain the role of analytics in supply chain planning, control, and strategic decision-making.
- Identify relevant supply chain datasets, data sources, and performance indicators.
- Clean, validate, structure, and prepare operational data using Excel and Power Query.
- Apply Excel formulas, lookup functions, PivotTables, and analytical tools to supply chain datasets.
- Use descriptive statistics and trend analysis to interpret supply chain performance.
- Develop demand forecasts and evaluate forecast accuracy using appropriate techniques.
- Analyse inventory levels, stock availability, replenishment performance, and working capital.
- Evaluate procurement expenditure, supplier performance, and purchasing efficiency.
- Measure logistics, transportation, warehousing, and distribution performance.
- Build Power BI data models and create meaningful DAX measures.
- Design interactive dashboards and visual reports for operational and management decisions.
- Apply analytical findings to recommend measurable supply chain improvements.
Learning Outcomes
Upon successful completion of the course, participants will be able to:
- Explain how analytical methods support supply chain efficiency and business performance.
- Consolidate supply chain data from spreadsheets and other structured sources.
- Produce reliable datasets by removing errors, handling missing values, and standardising information.
- Build Excel-based reports using formulas, PivotTables, charts, and analytical functions.
- Interpret demand trends, variability, forecast errors, and operational performance patterns.
- Calculate inventory metrics and identify excess stock, shortages, and replenishment improvement opportunities.
- Develop procurement and supplier performance reports using spend, price, quality, and delivery data.
- Analyse freight expenditure, delivery reliability, warehouse productivity, and distribution costs.
- Create structured Power BI data models using relationships and appropriate data transformations.
- Develop DAX measures to calculate KPIs, comparisons, ratios, and performance trends.
- Design interactive Power BI dashboards that communicate actionable insights to stakeholders.
- Present a supply chain analytics project containing evidence-based recommendations and measurable improvement opportunities.
Course Syllabus
Module 1: Introduction to Supply Chain Analytics and Data Fundamentals: Understand supply chain data, analytical methods, data sources, and business performance indicators.
Module 2: Excel for Supply Chain Data Preparation and Analysis: Clean, validate, consolidate, and transform operational datasets using Excel and Power Query.
Module 3: Advanced Excel Functions and Supply Chain Modelling: Apply formulas, lookup functions, PivotTables, conditional analysis, and spreadsheet models.
Module 4: Statistics, Trend Analysis, and Demand Forecasting: Analyse data distributions, demand variability, trends, seasonality, and forecast accuracy.
Module 5: Inventory Analytics and Optimisation: Measure stock performance, calculate replenishment parameters, and identify inventory improvement opportunities.
Module 6: Procurement and Supplier Performance Analytics: Analyse expenditure, supplier delivery, purchase price variance, quality, and sourcing performance.
Module 7: Logistics, Transportation, and Warehouse Analytics: Evaluate freight costs, delivery performance, warehouse productivity, and distribution efficiency.
Module 8: Power BI Data Preparation, Modelling, and DAX: Connect data sources, use Power Query, establish relationships, and create analytical measures.
Module 9: Interactive Power BI Dashboards and Reporting: Develop interactive KPI dashboards, drill-down reports, filters, and management visualisations.
Module 10: Integrated Supply Chain Analytics Project and Decision-Making: Combine Excel and Power BI to solve a business problem and present data-driven recommendations.